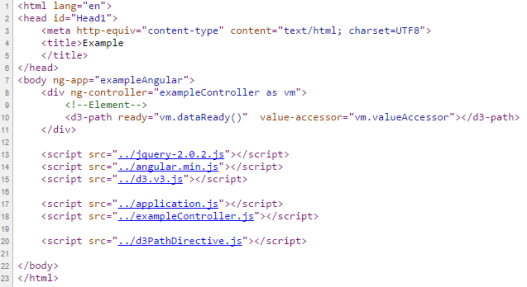
There are many ways to draw D3 graphs with AngularJS framework. This post will show you one of the simplest ways to do it. Below are the steps for draw a D3 path by creating an Angular Directive.
- Create Angular Directive
(function () {
 'use strict';
angular.module('exampleAngular.directives')
 .directive('d3Path', [function () {
 return {
  restrict: 'EA',
  scope: {
  ready: '=',
  valueAccessor: '='
  },
 link: function (scope, iElement) {
  var chart;
  d3.select(iElement[0]).append('svg').attr({
  'id': 'path-container',
  'width': 200,
  'height': 200
 })
 .append('g').attr( {'transform':'translate(0,5)'});
 scope.$watch('ready', function (newVals) {
   return scope.render(newVals);
 }, true);

// define render function
 scope.render = function (ready) {
  if (ready) {
    chart = new D3Path(scope.valueAccessor(),
                'path-container');
   }
   };
   }
   };
 }]);
}())

// function for draw D3 path
function D3Path(value, containerId) {
 var self = this, path, pathData = value, totalLength;
 options = {
 lineFunction: d3.svg.line()
 .x(function (d) { return d.x; })
 .y(function (d) { return d.y; })
 .interpolate('linear')
 };

 self.chart = function () {
 path = d3.select('#' + containerId).select('g').append('path')
 .attr('d', options.lineFunction(pathData))
 .attr('stroke','#ff0000')
 .attr('stroke-width', 2)
 .attr('fill', 'none');

 totalLength = path.node().getTotalLength();

 path
 .attr('stroke-dasharray', totalLength + " " + totalLength)
 .attr('stroke-dashoffset', totalLength)
 .transition()
 .duration(1000)
 .ease('linear')
 .attr('stroke-dashoffset', 0);

 return self;
 };

 return self.chart();
};
- include the element in html page
- Feed data through exampleControler.js
(function () {
 'use strict';

 angular.module('exampleAngular.controllers')
 .controller('exampleController', ['$scope',
function ($scope) {
 var vm = this;
 vm.dataReady = function () {
        reurn true;
 };
 vm.valueAccessor = getPathData;

function getPathData() {
var lineData = [{ "x": 1, "y": Math.random() * 100 },
      { "x": 20, "y": Math.random() * 100 },
      { "x": 40, "y": Math.random() * 100 },
      { "x": 60, "y": Math.random() * 100 },
      { "x": 80, "y": Math.random() * 100 },
      { "x": 100, "y": Math.random() * 100 },
      { "x": 120, "y": Math.random() * 100 }
      ]

 return lineData;
}

 }]);
}());
- application.js
(function () {
angular.module('exampleAngular', [
'exampleAngular.services',
'exampleAngular.controllers',
'exampleAngular.directives']);

angular.module('exampleAngular.services', []);
angular.module('exampleAngular.controllers', []);
angular.module('exampleAngular.directives', []);
}());
